Part B
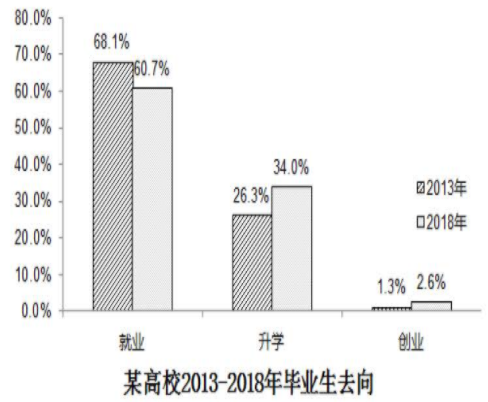
【题干】Directions: Write an essay based on the following chart. In your essay, you should interpret the chart, and give your comments.
You should write about 150 words on the ANSWER SHEET. (15 points)

【范文】
This bar chart above looks into the choices that concern graduates most when they settle down after schooling. With the staggering economy, most graduates choose to find a job after they leave school, even though there is a decline of about 8 percentage in 2018, comparing that in 2013. The least part of them choose to establish their own business after graduation, with 1.3 percentage in 2013 and 2.6 percentage in 2018. As to the students who ask for further study, it accounts for 26.3 percentage in 2013 and 34 percentage in 2018. Besides, we can see from the chart that more students choose to continue to study instead of working after education,comparing those in 2013.
This reflects a change of attitudes of graduates towards life after schooling. I can find no better reasons for this phenomenon other than the following two. On the one hand, most graduates want to find a break after four-year study at school. This indicates that youth today are eager to face challenges and want to put what they have learned into practice. On the other hand, students are facing an ever intense competition owing to the expansion of enrollment. Most students have to do their further study. Hardly can such students find favorable jobs.
It is high time that we took effective measures to solve the problem. For one thing, it is essential that proper polices be worked out to promote students' to run their own business. For another, students should be educated to get well-prepared for their future work. Only with this measure can our society improve for a sound development.


