大作文
Part B
Directions: Write an essay based on the following chart. In your essay, you should interpret the chart, and give your comments.You should write about 150 word s neatly on the ANSWER SHEET (15 points)
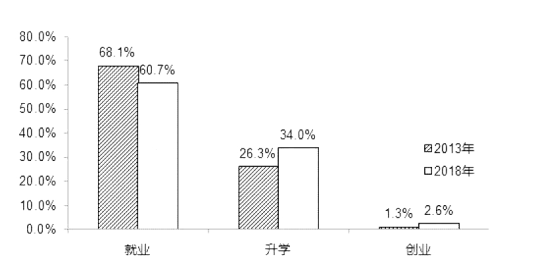
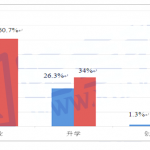
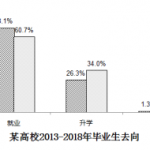
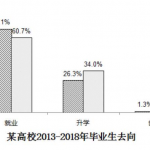
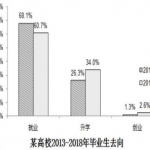
某高校2013-2018年毕业生去向
【范文】
What is illustrated in the chart demonstrates the changes in the percentage of the undergraduates’ choices in universities from 2013 to 2018. According to the chart, the percentage of further studying rose from 26.3% in 2013 to 34.0% in 2018, while there was a decline in the percentage of hunting for a job from 68.1% to 60.7%.
What is reflected in the chart is most thought-provoking and worth discussing among the general public for the time being. It is no difficulty for us to come up with several possible reasons to account for this phenomenon. First of all, it must be stressed that the present situation, to a certain degree, stems from government policies. The regulations and rules have been made and carried out by government and departments concerned so as to encourage students to further studying. In the second place, we may notice that social stress also plays an important role in leading to this phenomenon. The present society is filled with fierce competition, so most college students are under great pressure .Last but not least, personal development is another significant factor that cannot be ignored. The increasing number of students want to further their studying for self-realization. There may be other factors contributing to this phenomenon, but I think what has been mentioned above is generally reasonable.
Taking into account what has been argued, we can come to the conclusion that the present situation is positive. It is certain that this trend will continue in the years to come. Only in this way, can we promote the overall development of the society

